
The Psychology of Drawdowns: Why Losing Periods Destroy More Traders Than Losing Trades
Most traders can handle a losing trade. Very few can handle a losing month.

Most traders can handle a losing trade. Very few can handle a losing month. The difference between those two groups is not strategy, not edge, and not capital. It is an understanding of what drawdowns actually are and how to behave inside one.
There is a specific moment in a drawdown that separates professional traders from everyone else. It is not the first red day, nor the second. It is the moment the trader begins to wonder whether their edge has disappeared. Whether the strategy is broken. Whether they were simply lucky before. That moment of quiet, persistent doubt is where most accounts begin their real decline.
Drawdowns are the tax on every positive expectancy system that has ever existed. They are not anomalies. They are not signals that something is wrong. They are the mathematical and statistical consequence of operating in a probabilistic environment where even a strategy with genuine edge will produce extended sequences of losses. The professional understands this intellectually. What this newsletter is concerned with is whether they understand it operationally, when the account is down eight percent and every instinct says to change something.
This is not about how to avoid drawdowns. There is no such framework. This is about what a drawdown actually is from a statistical standpoint, how the human mind misinterprets it, what decisions traders make during one that permanently impair their long-term expectancy, and how a professional structure insulates performance from the behavioral damage that drawdowns reliably produce.
The central premise is straightforward. Drawdowns are a feature of every viable system, and the trader’s response to them is the single largest variable in long-term performance that remains within their control. Strategy matters. Execution matters. But the behavioral integrity maintained during a drawdown may matter more than both.
WHAT A DRAWDOWN ACTUALLY IS: THE STATISTICAL REALITY
A drawdown is a peak-to-trough decline in account equity measured over a specific period. This is the textbook definition, and it is almost entirely useless without context. A five-percent drawdown on a system that wins forty percent of the time with a two-to-one reward-to-risk ratio is entirely normal and expected. The same five percent on a high-frequency scalping strategy with a seventy-percent win rate may be a meaningful signal. The number alone tells you very little. The number relative to the system’s expected variance tells you everything.
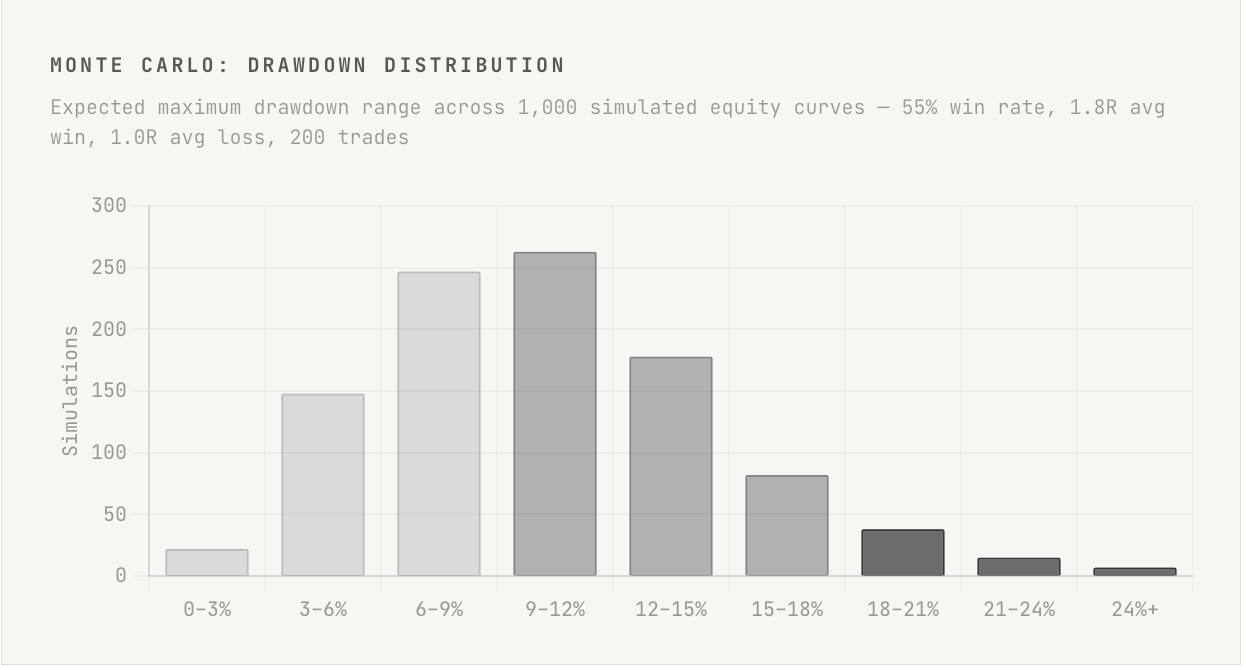
Every trading system with a positive expectancy will produce drawdowns of predictable sizes and durations when subjected to statistical analysis. If you run a Monte Carlo simulation on any real edge, one with a specific win rate, average win, and average loss, you will generate thousands of possible equity curve paths. Within those paths, you find the distribution of maximum drawdown values, the average length of losing streaks, the probability of a drawdown exceeding any given threshold over any given number of trades. The drawdown you are currently experiencing almost certainly exists somewhere in that distribution. The question is not whether it should be happening. The question is whether you understood the distribution before you began trading the system.
The fundamental failure mode is that most traders evaluate their system’s performance by examining their actual equity curve without any reference to the range of equity curves that system should theoretically produce. They see one path, the one they lived, and judge it as either good or bad. A professional evaluates each equity curve against the statistical distribution of possible curves for that system. One losing month on a system with a two-percent monthly edge and a known standard deviation of four percent is not a signal of anything except the existence of variance.
The misunderstanding is almost always one of sample size. Traders with a six-month track record believe they have enough data to know whether their edge is real. In most cases, they do not. A system trading twenty times per month with a fifty-five percent win rate needs several hundred trades before the edge begins to separate from noise with any statistical confidence. The drawdown a trader is experiencing after sixty trades may be entirely within the expected range of outcomes for their strategy, and they have no reliable way to distinguish it from genuine edge degradation using their trade history alone. This is what makes drawdowns psychologically brutal. They arrive at precisely the moment when you have the least statistical certainty about whether the problem is the system or the environment.
PRACTICAL APPLICATION
Before trading any strategy live, run a Monte Carlo simulation with at least one thousand iterations using your system’s historical win rate, average win, and average loss. Record the expected maximum drawdown at the 95th percentile. That number is your statistical reference for what a bad period looks like, not your personal feeling of what is acceptable.
When in a drawdown, the first question to ask is not “is my strategy broken” but “where does this drawdown fall within the expected distribution for my system?” If it falls below the 90th percentile of simulated outcomes, continue executing. If it approaches or exceeds the 95th, a structured review is warranted. Not a behavioral change. A structured review. Keep a separate log of your system’s performance metrics updated weekly: win rate, average win, average loss, and expectancy per trade. These numbers should be your reference frame, not the equity curve alone.
THE ANATOMY OF BEHAVIORAL COLLAPSE DURING A DRAWDOWN
The most costly aspect of a drawdown is rarely the drawdown itself. It is the sequence of behavioral decisions the trader makes in response to it. These decisions follow a remarkably consistent pattern across traders of different styles, asset classes, and experience levels, which suggests they are driven less by individual personality and more by a predictable set of cognitive responses to loss and uncertainty.
The sequence typically begins with what feels like reasonable caution. The trader reduces position size, waits for higher-quality setups, or applies additional filters to their entry criteria. This feels like discipline. It is described internally as protecting capital. In reality, it marks the beginning of a departure from the system’s defined structure. Once rules become flexible in one direction, they become flexible in all directions, and the strategy being executed is no longer the strategy that was tested.
The second stage involves a shift in focus from process to outcome. The trader becomes increasingly result-oriented at the individual trade level. Decisions that were once made according to criteria start being made according to recent experience. A setup that would have been taken cleanly two weeks ago now generates hesitation because the last three similar setups lost. The system is still producing valid signals. The trader is no longer taking them consistently.
The third stage, which is where the real damage accumulates, involves compensatory behavior. Revenge trading, oversizing after a win to recover lost ground, seeking trades outside the defined strategy. Each of these responses feels like taking control. Each of them adds noise that the system’s edge cannot absorb.
What makes this sequence so destructive is that each step feels justified at the time. The trader is not being reckless. They are being responsive to what they believe is new information. The drawdown itself becomes the justification for abandoning the structure that was built to survive it. Professionals understand that this is precisely backwards. The structure matters most when the impulse to abandon it is strongest. A drawdown is not the moment to reassess the system. It is the moment to execute it with the most disciplined adherence possible.
PRACTICAL APPLICATION
Journal behavioral decisions separately from trade decisions during any drawdown. Not what the trade did. What you did, and whether it matched the written rules. A losing trade executed correctly is information about the system’s variance. A losing trade executed with a modified stop, a smaller size, or an early exit is information about behavioral drift. These are different data points and must be tracked separately.
If you notice that your most recent twenty trades have seen meaningful deviation from the written plan, the drawdown analysis changes entirely. Part of what you are experiencing is self-inflicted, not statistical. Separating those two components is the only way to accurately assess whether the edge remains intact.
HOW DRAWDOWNS DISTORT RISK PERCEPTION
One of the least discussed consequences of a drawdown is what it does to a trader’s calibration of risk. Under normal conditions, a trader operating with a defined risk-per-trade of one percent understands, approximately, what that means in practice. They have a reference frame built from experience. During a drawdown, that reference frame is contaminated. The one-percent risk that felt comfortable thirty trades ago now feels existential, because the account is already depleted, because each loss is experienced with heightened attention, and because the emotional weight attached to each trade has increased substantially.
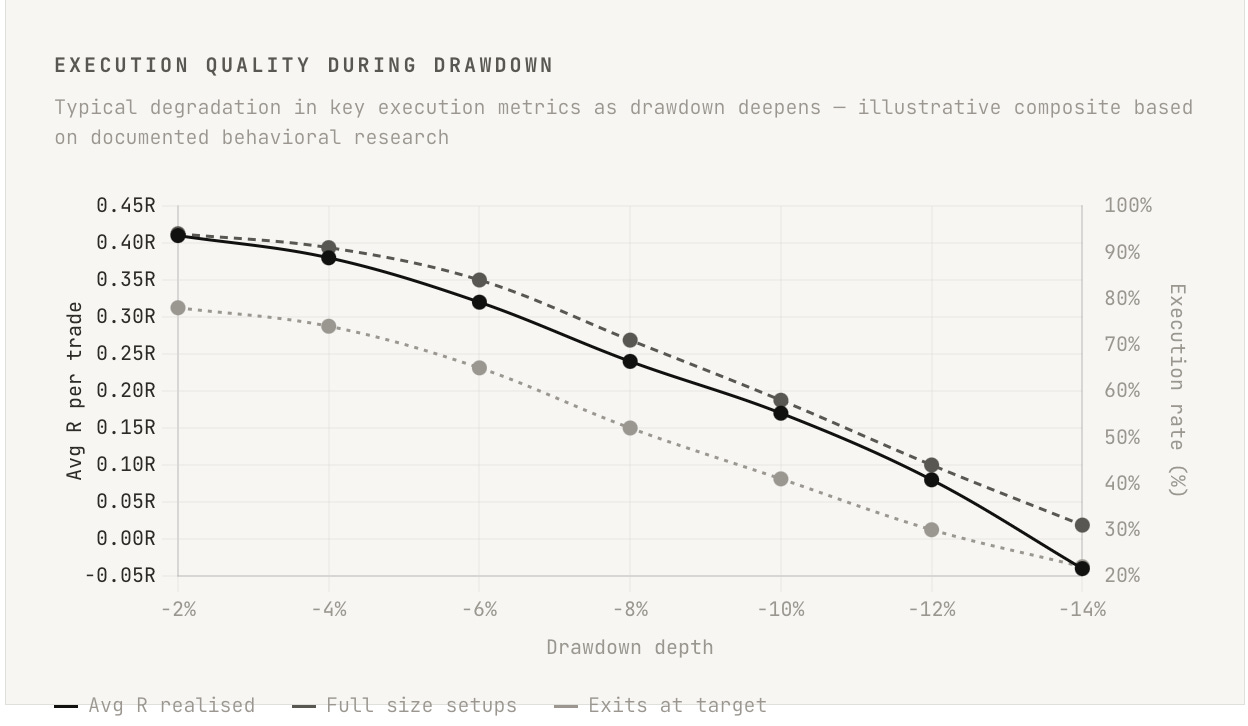
This is not simply a feeling. It has measurable consequences on execution. Traders in drawdown consistently demonstrate earlier exits from winning trades, taking partial profits before targets are reached, reducing what would have been two-R winners into half-R winners. They place wider initial stops in an attempt to avoid being stopped out, which paradoxically increases actual risk per trade while compressing the reward-to-risk ratio. They apply selective setup execution, taking the setups that feel safer and avoiding the ones that feel exposed, without any statistical basis for that discrimination.
The cumulative effect is a real-time degradation of expected value. The system that had a positive expectancy of 0.4R per trade is now being executed in a way that produces something closer to 0.1R or negative. The edge still exists in the strategy. It has been removed from the execution.
The distinction that professionals maintain, and it is genuinely difficult to maintain during a drawdown, is between risk management at the system level and risk aversion at the behavioral level. The former is rational and necessary. The latter is the response to emotional distress, and it must be identified and removed from the decision-making process. Traders experience behavioral risk aversion as caution. They are being careful with capital. This is the language of risk management applied in a way that is actively destroying long-term performance.
PRACTICAL APPLICATION
Run a post-drawdown audit that separates outcomes into two categories. Losses that occurred because the strategy’s edge was not present, and losses that occurred because execution deviated from the strategy’s rules during the setup. The second category is a behavioral cost, not a strategic one, and it should be quantified separately from the first.
During a drawdown, implement a mandatory review before each trade entry that answers one question. Am I taking this trade, sizing it, and managing it exactly as I would if my account were at all-time highs? Any deviation from that standard requires written justification before execution proceeds. This is not a theoretical exercise. It is the only mechanism that reliably surfaces real-time behavioral drift before it compounds into structural damage.
THE COMPOUNDING PROBLEM: WHEN BEHAVIORAL ERRORS EXTEND THE DRAWDOWN
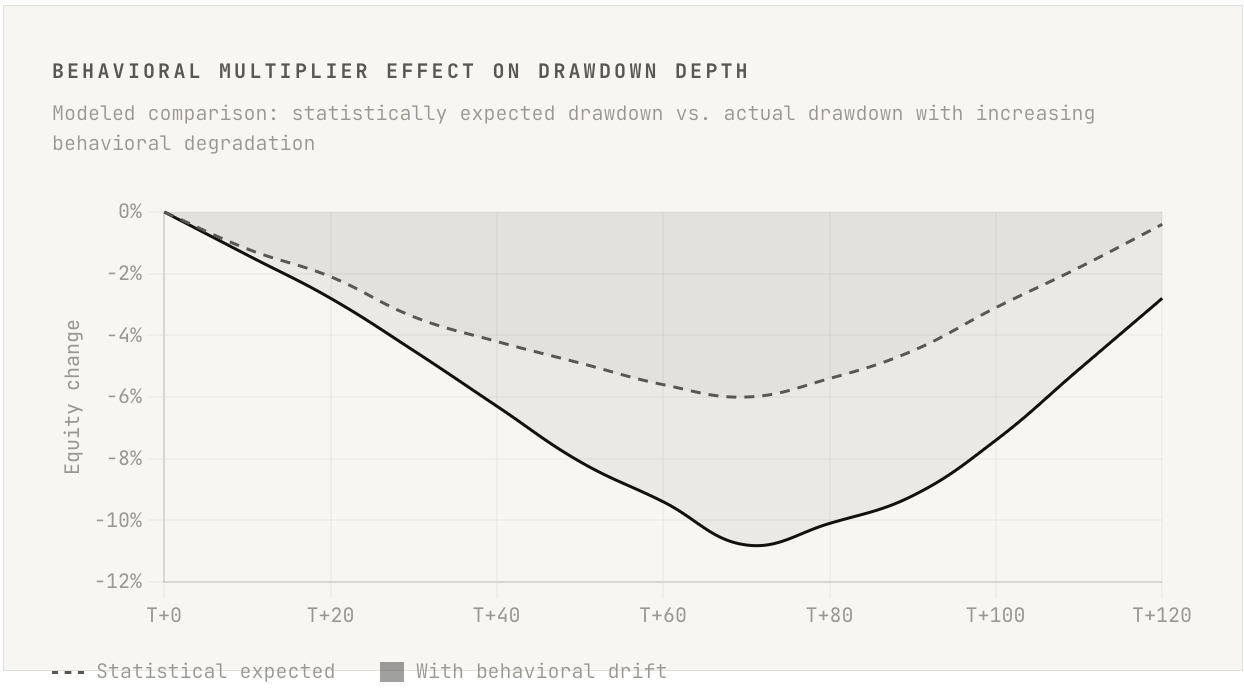
There is a compounding dynamic in drawdowns that is rarely discussed, because it requires acknowledging an uncomfortable truth. Many extended drawdowns are not prolonged by continued bad luck. They are prolonged by the behavioral degradation that the drawdown itself produces. The trader enters a losing period. Behavioral responses degrade execution quality. Degraded execution produces worse outcomes than the raw strategy would have generated. Those worse outcomes deepen the drawdown. The deeper drawdown intensifies the behavioral responses. The cycle continues until either capital is exhausted or the trader steps far enough back from the process to break the loop.
This means the actual depth and duration of a drawdown is a function of two distinct things. The statistical reality of the system’s variance, and the behavioral multiplier applied by the trader’s responses. The first is fixed by the nature of the strategy and the market environment. The second is entirely within the trader’s control, and it can meaningfully extend the drawdown beyond what the statistical distribution would predict.
Professional trading operations understand this at an institutional level, which is why drawdown protocols are not primarily about capital preservation. They are about behavioral containment. When a fund manager hits a defined drawdown threshold, they are required to reduce exposure, not because the strategy is more likely to be broken at that threshold than at any other, but because the behavioral degradation associated with significant losses is known, documented, and predictable. The institutional response is to remove the conditions that produce it.
INSIGHT
The individual trader operating without institutional oversight must build the equivalent of those protocols themselves. And they must build them at a moment when they feel unnecessary, when the account is performing well and the idea of a ten-percent drawdown feels abstract. Protocols designed during a drawdown are almost always compromised by the emotional state in which they were created. The objectivity required to build a useful framework is only fully available when it feels least urgent.
PRACTICAL APPLICATION
Define three drawdown levels — yellow, orange, and red — based on your system’s Monte Carlo distribution, not on arbitrary round numbers. At each level, the protocol specifies a different response. Yellow triggers a review. Orange triggers a size reduction and daily journaling. Red triggers a full pause and an independent evaluation. These responses should be automatic and pre-committed, not decided in the moment under pressure.
The most important rule of any drawdown protocol is a prohibition on adding new variables. During a drawdown, you are not permitted to experiment with new setups, adjust your timeframe, or modify your risk parameters beyond the predetermined reduction at the orange threshold. The time for experimentation is outside of drawdown periods. This rule is not about rigidity. It is about preserving the clean statistical picture that allows you to evaluate whether the underlying edge remains intact.
THE DISTINCTION BETWEEN VARIANCE AND EDGE DEGRADATION
This is the question at the center of every meaningful drawdown. Is the strategy’s edge still intact, or has something changed in the market environment that has genuinely degraded it? The difficulty is that during the drawdown itself, the question is almost impossible to answer with confidence. You are working with limited data, an active emotional state, and a market that does not broadcast its regime changes on a schedule. Nevertheless, there are frameworks for making this distinction more rigorously than pure intuition allows.
The first distinction to make is between process-level metrics and outcome-level metrics. Outcome-level metrics, win rate, returns, drawdown depth, are contaminated by variance in the short term and cannot reliably distinguish a strategy with intact edge from a strategy with temporarily bad luck. Process-level metrics, the quality of setup formation, the alignment of trade conditions with the strategy’s rules, the ratio of trades taken that met full criteria, are substantially more informative. If a strategy’s process-level metrics are intact and the outcomes are poor, that is almost certainly variance. If the process-level metrics are also degrading alongside the outcomes, that warrants serious investigation.
The second distinction involves examining what has changed in the market environment relative to the conditions in which the strategy was developed and tested. Strategies built around mean-reversion in low-volatility regimes will underperform in trending, high-volatility periods. Strategies that exploit specific structural inefficiencies may lose edge if market microstructure changes, if participants adapt, or if the inefficiency becomes widely known. These are structural questions, and they require structural analysis rather than equity curve observation.
The honest professional answer to “has my edge degraded” in most drawdown scenarios is this: I cannot know with statistical certainty yet, and I should not act as if I do. This is an uncomfortable position to hold. It requires continuing to execute a strategy that is losing money without the psychological relief of either changing it or stopping. It is, however, the correct response in the majority of cases where the drawdown falls within the expected statistical distribution. The alternative, concluding that edge has degraded and modifying the strategy, carries a significant false positive rate and produces the behavioral damage described in earlier sections.
“The market does not owe you confirmation that your edge still works. The absence of that confirmation during a losing period is not evidence that it does not.”
PRACTICAL APPLICATION
Maintain a process scorecard for every trade, separate from the outcome log. Score each trade on whether the entry conditions were fully met, whether the trade was sized correctly, and whether the management followed the rules. A high process score with poor outcomes is variance. A low process score with poor outcomes is a behavioral problem. A high process score with consistently poor outcomes across a statistically significant sample is a potential edge degradation signal. These are three entirely different situations that require three entirely different responses.
When suspecting genuine edge degradation, the investigation should focus on specific and answerable questions. What market conditions does this strategy require? Have those conditions been present during the drawdown period? What would need to be observed to conclude the edge is intact versus absent? These questions have data-based responses. The question “does the strategy still work” does not, and pursuing it as framed leads to emotional rather than analytical conclusions.
WHY THE RECOVERY PERIOD IS MORE DANGEROUS THAN THE DRAWDOWN ITSELF
Traders who survive a significant drawdown without major behavioral damage often make their most consequential errors in the recovery phase. Having endured weeks or months of losses, the account begins recovering, and a new psychological dynamic emerges: the urgency to recoup. This urgency is not experienced as aggression. It is experienced as motivation, as renewed determination, as the restoration of confidence. Underneath it is a subtle and persistent acceleration of risk-taking that, if left unchecked, will produce a second drawdown that is frequently deeper than the first.
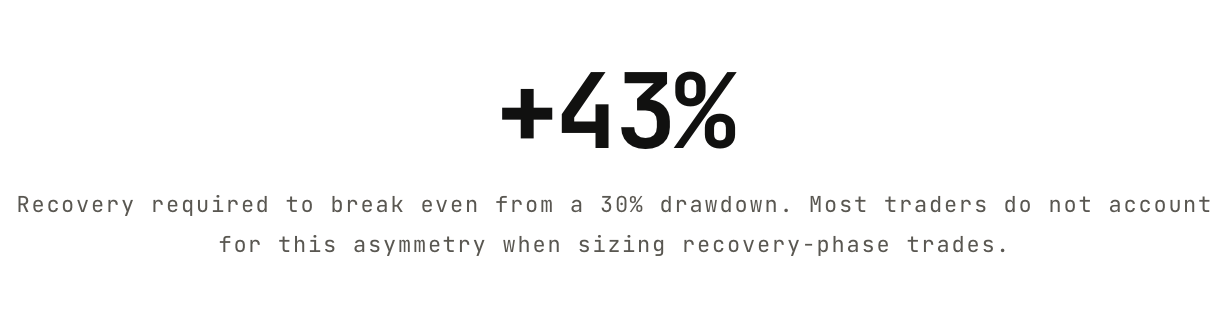
The mathematical reality of recovery is that the position is not symmetric with the loss. A twenty-percent drawdown requires a twenty-five-percent recovery to reach breakeven. A thirty-percent drawdown requires a forty-three-percent recovery. A forty-percent drawdown requires a sixty-seven-percent recovery. These asymmetries are not intuitive, and they create pressure to take larger risks during the recovery phase than the strategy’s parameters support. A trader trying to recover fifteen percent in two months on a system that generates two percent per month with a four-percent standard deviation is not executing a strategy. They are gambling with the account and with the psychological infrastructure required to sustain long-term performance.
The professional response to the beginning of a recovery is to do exactly what was done during the drawdown: execute the strategy at standard parameters with no behavioral modification. The recovery will happen at the pace the strategy produces it, or it will not be sustainable. Any attempt to accelerate it by increasing size prematurely, taking setups outside the core strategy, or reducing selectivity to increase trade frequency introduces variables that cannot be controlled and risks that were not accounted for in the system’s design.
PRACTICAL APPLICATION
Return to standard position sizing only after the account has recovered a defined percentage of the drawdown, not at the first sign of recovery. A common professional threshold is fifty percent recovery of the drawdown before returning from reduced size. This is not a rigid rule but an example of the kind of structure that prevents premature risk escalation before behavioral stability has been re-established.
During the recovery phase, continue the daily behavioral journaling established during the drawdown. The emotional pressure to recoup is as destructive as the emotional pressure generated by the losses themselves, and it requires the same monitoring framework. Recovery is not complete when the account returns to the prior equity high. It is complete when the trader’s behavior has returned to full structural alignment with the written system.
THE PROFESSIONAL STRUCTURE: WHAT INSTITUTIONAL TRADERS DO DIFFERENTLY
The behaviors described throughout this newsletter are not unique to retail traders. They appear in professional settings as well, which is why institutional trading operations have developed structural responses to drawdown periods that go far beyond simple risk limit rules. The key insight from institutional practice is that the management of drawdowns is treated as a separate discipline from the management of trades. It requires its own protocols, its own metrics, and its own decision-making framework that operates independently of the strategy itself.
At the most basic level, institutional traders are required to report to risk management as drawdown thresholds are crossed. This is not purely a capital protection measure. It is a behavioral check. The act of reporting creates accountability and introduces an external perspective at precisely the moment when internal perspective is most distorted. The risk manager does not evaluate whether the strategy is working. They evaluate whether the trader is executing the strategy as designed. Those are two entirely different questions that require different information and different analytical frameworks.
Beyond reporting, institutional operations typically mandate a behavioral audit at significant drawdown levels. The trader reviews their most recent decisions against the strategy’s rules. Deviations are documented and explained. This process does two things: it surfaces behavioral drift the trader may not have been aware of, and it provides a structured opportunity to reconnect with the logic of the strategy at a moment when emotional noise is at its peak.
The individual trader cannot replicate the full institutional structure, but they can replicate its essential function: an external, objective perspective that evaluates execution quality rather than outcomes. This can take the form of a trading partner who reviews decision logs, a structured self-audit protocol conducted at defined drawdown levels, or a mentor who evaluates the behavioral record rather than the equity curve. The specific mechanism matters less than the function it serves. Objectivity where subjectivity has become unavoidable.
PRACTICAL APPLICATION
Build a personal drawdown playbook that documents, in writing, the exact actions to be taken at each threshold level. The playbook should specify what size reduction to make, what review process to follow, what external check to complete, and what conditions must be met before returning to full operation. Written playbooks, reviewed quarterly when performance is good, are far more reliable than in-the-moment judgment during a drawdown, when the mental environment required to make sound structural decisions is least available.
Identify one person, a trading partner, a mentor, or a colleague with strong analytical thinking, who can serve as your external perspective during significant drawdowns. Their role is not to evaluate your strategy. It is to review your behavioral record and ask whether your decisions during the drawdown period are consistent with your written rules. This function is simple, and it is the single most valuable structural addition most serious individual traders are missing.
REFRAMING THE DRAWDOWN: OPERATING IN A PROBABILISTIC SYSTEM
The deepest structural problem with how most traders relate to drawdowns is a fundamental misunderstanding of what they are participating in. Trading is not a game where skill produces consistent, predictable results in the short term. It is a probabilistic process where skill produces a positive expectancy that expresses itself over a sufficiently large sample of repetitions. Within any individual sample, any single month, quarter, or even year, the outcome can be dominated by variance. This is not a flaw in the game. It is the game.
When a trader experiences a drawdown as a judgment on their ability, as evidence of failure, or as a problem to be solved with a change of approach, they are operating under an incorrect model of what trading is. The correct model is that each trade is a sample from a distribution. The distribution has certain properties, a mean, a standard deviation, a skew, determined by the strategy’s characteristics. The actual outcome of each trade is drawn from that distribution but is not determined by skill or error in any individual instance. Skill determines the shape of the distribution. Individual outcomes are random draws from it.
This reframing is not merely philosophical. It has direct operational consequences. If each trade is a random draw from a distribution, the appropriate response to a bad sequence is to continue drawing, not to change the distribution, not to stop drawing, and not to attempt to predict which draws will be favorable. The appropriate response is to ensure you are drawing from the distribution as designed, that your risk parameters keep you alive long enough for the expectancy to express itself, and that your behavioral responses do not introduce noise into the distribution that was not there by design.
The traders who navigate significant drawdowns without permanent damage to their performance or their capital are, almost without exception, the ones who have genuinely internalized this model rather than merely described it. There is a meaningful difference between being able to articulate “trading is probabilistic” and actually experiencing a five-percent drawdown as a normal statistical event rather than a crisis. The gap between those two states is where most serious trading development work needs to happen. Not in the refinement of entry signals or the optimization of parameters, but in the deep revision of one’s actual relationship with uncertainty and outcome.
PRACTICAL APPLICATION
Periodically revisit your Monte Carlo simulation results when your account is performing well. The purpose of reviewing them during good periods is to build genuine familiarity with the range of outcomes your strategy can produce, so that when the difficult periods arrive, they feel statistically familiar rather than catastrophic. Exposure to the range of possibility in advance is the best preparation for the psychological experience of the worst-case end of that range.
Replace the question “why is this happening” with the question “where does this fall in the expected distribution?” The first question leads to narrative-building, rationalization, and behavioral drift. The second leads to statistical evaluation and, in most cases, the conclusion that continued consistent execution is the correct response. The ability to ask the second question under pressure, rather than the first, is what distinguishes probabilistic thinking from emotional thinking. It is a skill that must be developed deliberately, not assumed.
The central shift this newsletter has argued for is deceptively simple: from evaluating drawdowns as evidence of something, of failure, of a broken strategy, of poor judgment, to evaluating them as statistical events within a known distribution. This shift changes everything about how a trader behaves during a losing period, because behavior driven by statistical interpretation is fundamentally different from behavior driven by narrative and emotion.
Drawdowns will always feel worse than they should. This is not a cognitive failure unique to inexperienced traders. It is a documented feature of how human beings process sequential losses, compounded by the fact that financial loss carries a weight that most other uncertainties do not. The professional response to this reality is not to eliminate the feeling. It cannot be eliminated. It is to build systems, protocols, and frameworks that govern behavior in a way that does not depend on the feeling being absent.
Strategy is the starting point. Edge gives you a positive expectancy over a large sample. But it is the structure around how you behave during the inevitable losing periods that determines whether you survive long enough, and execute consistently enough, to actually realize that expectancy in your account. Many traders with genuine edges never see them expressed in their performance records, because the behavioral damage accumulated during drawdowns exceeded the gains generated when the edge was performing normally.
The work of becoming a professional trader is, in large part, the work of becoming someone who can operate a probabilistic system through its worst expected periods without adding behavioral noise that the system’s edge cannot absorb. That is a precise, demanding, and entirely learnable discipline. But it is learned primarily in the context of drawdowns, in the moments when the pressure to do something is highest and the statistical case for doing nothing is most clear.
Every system with real edge has survived a drawdown. Every trader who realized that edge has survived the psychology of one.