
How to Know When Your Edge Has Actually Stopped Working

The question every trader eventually faces is also the one most consistently answered incorrectly. Has my edge stopped working, or am I just in a losing streak? Getting this wrong in either direction is expensive. Abandoning a sound strategy during a normal drawdown is as destructive as continuing to trade a genuinely broken one.
There is a specific asymmetry in how traders make this mistake. When a strategy stops performing, the instinct is to act. Change the rules. Adjust the parameters. Try a different timeframe. The action feels like taking control and responding intelligently to new information. In most cases it is neither. It is a behavioral response to discomfort, executed at the worst possible moment, on the basis of a sample too small to support the conclusion it appears to justify.
At the same time, the risk of the opposite error is real. Strategies do stop working. Markets evolve, structural inefficiencies get arbitraged away, participant behavior shifts, and what generated genuine edge in one period produces consistently negative expectancy in another. A trader who never questions whether their edge remains intact is not being disciplined. They are being rigid in a way that will eventually cost them the account.
The framework this newsletter builds is designed to navigate between those two failure modes. It rests on the distinction between variance and structural change, between process degradation and outcome degradation, and between a regime shift and genuine edge disappearance. Each distinction requires different evidence and a different response.
WHY THE QUESTION IS SO DIFFICULT TO ANSWER?
The core difficulty is statistical. Every trading strategy with positive expectancy will produce, as a mathematical certainty, extended sequences of losing trades. The length and depth of those sequences is determined by the strategy’s win rate, average win-to-loss ratio, and the inherent randomness of individual trade outcomes. A strategy with a fifty-five percent win rate will, over a sufficiently large sample, produce losing streaks of eight, ten, or twelve consecutive trades with a frequency that would surprise most traders who have not run the simulation. Those streaks are not evidence that anything is wrong. They are evidence that the strategy is behaving exactly as its statistical profile predicts.
The problem is that from inside a losing streak, it is impossible to know in real time whether the streak is one of those expected sequences or the beginning of something structural. The market provides no signal that distinguishes the two. The performance data looks identical in both cases while it is happening. The trader is left trying to draw a meaningful conclusion from a sample that is almost certainly too small to support one, under emotional conditions that make objective analysis unusually difficult.
This is compounded by a second difficulty: most traders have not done the statistical work required to know what a normal losing streak looks like for their specific strategy. They have a vague intuition that losing three in a row is fine but losing eight is probably a problem. That intuition has no mathematical basis. The actual threshold depends entirely on the specific parameters of the system, and it is different for every strategy.
Before any meaningful evaluation of edge degradation is possible, a trader needs a statistical reference frame for their system. This reference frame cannot be built during a drawdown. It must be built in advance from the system’s historical parameters. Without it, every evaluation of whether the edge is intact defaults to intuition and emotional assessment, which are reliably wrong in the direction of concluding that the edge is broken sooner than the data actually supports.
PRACTICAL APPLICATION
Run a Monte Carlo simulation on your primary strategy using its actual win rate, average win, and average loss from at least two hundred trades. Generate one thousand simulated equity curves. Record the expected maximum consecutive losing streak at the 75th, 90th, and 95th percentile, the expected maximum drawdown at those same percentiles, and the probability of a drawdown exceeding your current actual drawdown. These numbers become your reference frame. Any evaluation of whether your edge is intact should begin by locating your current performance within this distribution, not by comparing it to how you feel about recent results.
OUTCOME DEGRADATION VS PROCESS DEGRADATION
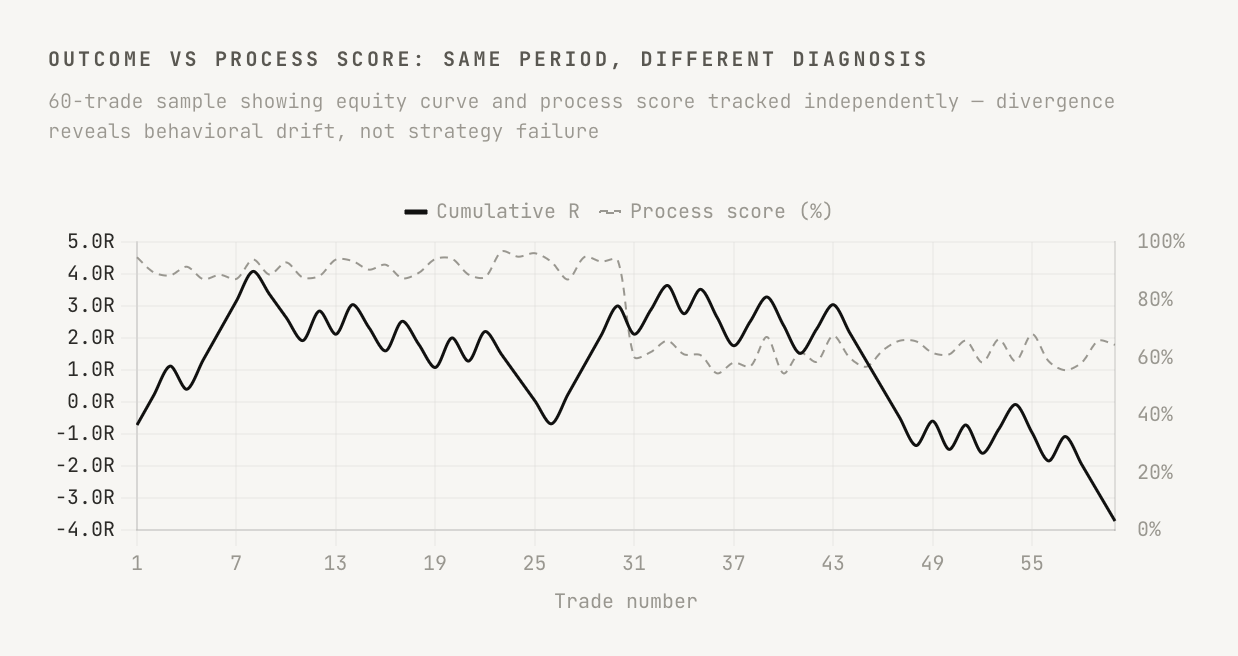
Outcome degradation and process degradation are two entirely different phenomena that produce identical-looking results on an equity curve. Outcome degradation means the strategy itself is generating worse results than its historical parameters would predict, independent of how it is being executed. Process degradation means the trader is executing the strategy differently than its rules specify, producing worse results than a mechanical execution of the same rules would generate. Both produce a declining equity curve. Neither can be distinguished from the other by examining the equity curve alone.
This distinction matters enormously because the correct response to each is completely different. If outcomes are degrading while the process remains clean, the investigation should focus on the strategy itself and the market environment. If the process is degrading, the investigation should focus on the trader’s behavior, and the strategy may well be performing exactly as it should once the execution noise is removed. Acting on the wrong diagnosis produces the wrong remedy, and the wrong remedy in trading almost always makes the situation worse.
Process degradation is far more common than outcome degradation, and it almost always accompanies a losing period because the behavioral responses to consecutive losses — reduced sizing, premature exits, skipped setups, widened stops — systematically damage the realized expectancy of a strategy even when the underlying edge remains intact.
The only way to distinguish these two forms of degradation is to maintain a process scorecard that is separate from the outcome log. Every trade should be scored on whether it was taken according to the written rules, sized correctly, and managed as specified. This scoring must be done honestly before outcomes are reviewed, because outcome knowledge contaminates process assessment in ways that are difficult to control. A losing trade that was correctly executed scores a perfect process score. A winning trade that violated multiple rules scores poorly. Both are necessary for meaningful evaluation.
PRACTICAL APPLICATION
Score every trade on a simple binary process checklist before reviewing the P&L: was the entry condition fully met, was the stop placed at the correct structural level, was the size correct, and was the exit taken at the predetermined target or stop without discretionary modification. Track the rolling average process score across your last twenty trades. A declining process score during a drawdown is the single most reliable early indicator that the problem is behavioral rather than structural.
REGIME CHANGE IS NOT EDGE DEGRADATION
One of the most common misdiagnoses in trading is interpreting a regime shift as edge failure. A momentum strategy that stops working during a low-volatility, range-bound period has not lost its edge. It is performing exactly as its underlying hypothesis predicts, because the market behavior the strategy exploits is temporarily absent. When the regime changes and trending conditions return, the edge returns with it. The trader who abandoned the strategy during the range-bound period has not protected themselves. They have exited at the worst possible time and will almost certainly re-enter at the worst possible time as well.
Regime shifts produce temporary performance degradation that is specific to conditions in which the strategy operates. Genuine edge degradation produces performance degradation that is persistent across all market conditions, including the ones that previously supported the strategy’s strongest results. That persistence across conditions is one of the clearest signals that something structural has changed rather than something environmental.
The practical test is to segment recent performance by regime type. If the strategy has been underperforming specifically during periods that do not match its optimal conditions and performing normally during periods that do, the edge is intact and the regime is the variable. If the strategy is underperforming uniformly across all conditions including the ones it previously handled well, the investigation needs to go deeper.
“A strategy that fails in the wrong conditions is working correctly. A strategy that fails in the right conditions is the one worth investigating.”
PRACTICAL APPLICATION
Tag every trade in your journal with a regime label using two or three characteristics that define your strategy’s optimal environment. After each trading month, calculate your average R per trade separately for trades taken in the correct regime versus trades taken outside it. Most traders find that their poor-regime trades account for a disproportionate share of total losses, and their in-regime performance remains close to historical expectations even during periods when the aggregate results look poor.
THE STATISTICAL THRESHOLDS THAT ACTUALLY MATTER
Intuitive thresholds for when to pause, review, or stop trading are almost always set too conservatively. Traders who decide that five consecutive losses constitute a meaningful signal are using a threshold that a strong edge will breach routinely through normal variance. Traders who wait for fifteen consecutive losses before acting may sit on a genuinely broken strategy for months. Neither threshold is derived from the actual statistical properties of the system, and both produce the wrong response at the wrong time.
The thresholds that matter are derived directly from Monte Carlo simulation and expressed in terms of probability rather than absolute counts. The useful question is not “how many consecutive losses is too many?” It is “what is the probability that the performance I have observed over the last N trades would occur by chance if my edge were intact?” When that probability drops below a threshold decided in advance, a structured review is warranted. Above it, continued execution is the correct response regardless of how recent results feel.
95%
The Monte Carlo percentile threshold below which a drawdown is most likely variance, not structural failure. Most traders trigger reviews at the 60th percentile.
Setting these thresholds in advance, during a period when the strategy is performing normally, is the only way to ensure they are set rationally rather than emotionally. A threshold set during a drawdown will almost always be set too low, because the emotional pressure to act makes even statistically normal outcomes feel like evidence of something serious.
PRACTICAL APPLICATION
Define three review thresholds for your primary strategy based on Monte Carlo simulation: yellow triggers a process audit but no changes to execution; orange triggers a size reduction and a formal written review of recent trades against the strategy’s rules; red triggers a full pause and an independent evaluation of whether the strategy’s underlying hypothesis still applies. Write these thresholds down with the specific statistical basis for each, and review them quarterly when the account is performing normally.
WHAT GENUINE EDGE DEGRADATION ACTUALLY LOOKS LIKE
Genuine edge degradation has specific characteristics that distinguish it from variance and from regime-driven underperformance. The first is persistence across conditions. When an edge genuinely degrades, it underperforms not just in unfavorable regimes but in the conditions that previously supported its strongest results. A momentum strategy that used to generate 0.6R per trade in trending conditions and is now generating 0.1R in the same trending conditions has likely experienced structural degradation. The same strategy generating 0.1R across a period dominated by choppy, range-bound conditions has probably experienced a regime shift and nothing more.
The second characteristic is a statistically significant and persistent shift in one or more of the core expectancy components. Win rate stable at fifty-five percent over two hundred trades that has now declined to forty-two percent over the subsequent one hundred trades, across comparable market conditions, is a meaningful signal. A temporary dip during a twenty-trade period is almost certainly noise. Persistence and magnitude relative to the historical baseline are what distinguish signal from variance.
The third characteristic is a change in the quality of how the market responds to the setup. The entries that previously resulted in immediate continuation are now reversing quickly. The levels that previously held are now being violated cleanly. These behavioral changes in the market’s response often appear before the statistical evidence in the trade log becomes conclusive, and they require the kind of calibrated awareness that only develops through extended observation of a specific setup across many market conditions.
A trader who has taken the same setup four hundred times has a qualitative reference frame for how the market typically responds to it that a trader with forty repetitions does not. This is one of the genuine advantages of specialization and repetition. The signals of structural change become legible earlier to someone who has watched a setup behave across enough different environments to develop a reliable sense of its normal behavior.
PRACTICAL APPLICATION
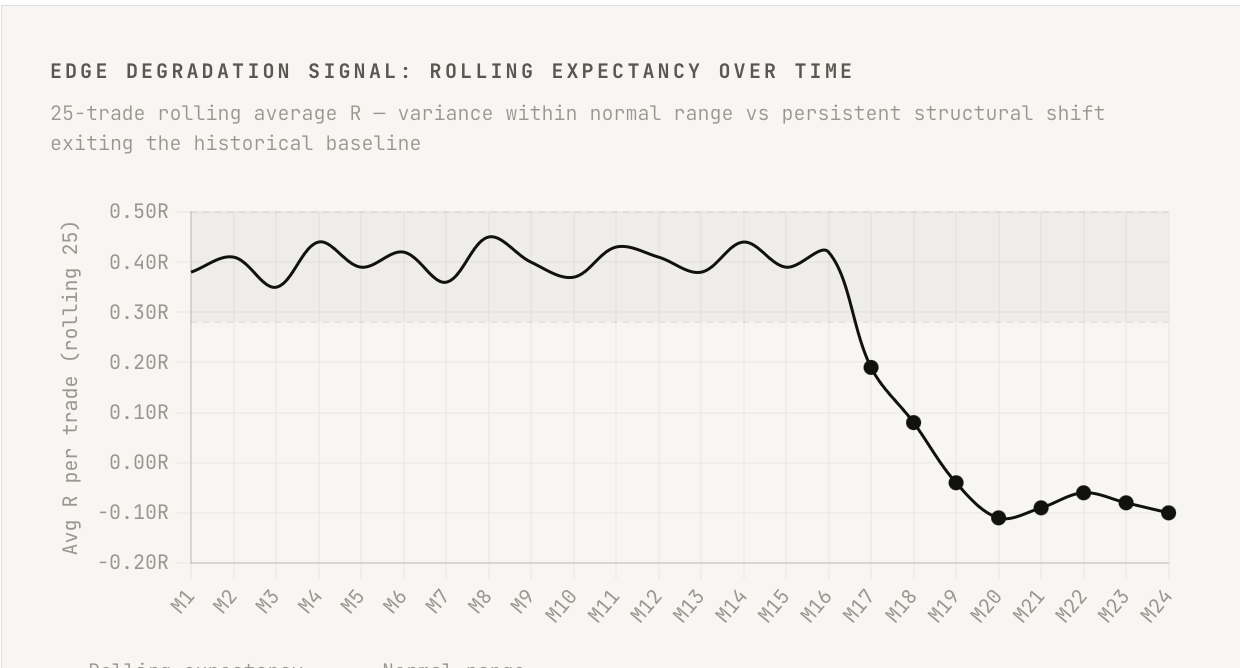
Track a twenty-five trade rolling average of your expectancy per trade and plot it over time. Establish the historical range of this rolling average during a period when the strategy was clearly working. A rolling average that exits this historical range and remains outside it for more than one rolling window is a meaningful degradation signal. One that briefly dips below the range and recovers is almost certainly variance. The distinction between those two behaviors is the entire diagnostic.
THE STRUCTURED REVIEW PROCESS
When statistical thresholds have been crossed and a structured review is warranted, the review itself must follow a specific sequence to be useful. A review conducted without structure is not a diagnostic process. It is a post-hoc rationalization exercise where the trader examines recent trades looking for patterns that confirm the conclusion already emotionally reached. A structured process is the only reliable way to distinguish between a behavioral problem, a regime problem, and a genuine strategic problem.
The review should proceed in this order. First, examine the process score data without looking at outcomes. Identify whether execution has deviated from the written rules in any systematic way. If it has, the strategy has not been fairly tested and the investigation should focus on behavioral drift. Second, examine the regime conditions present during the review period and compare them to the conditions in which the strategy’s historical parameters were established. If the regime has been systematically different, that is the most parsimonious explanation for the performance difference. Third, if both process and regime appear consistent with historical norms and performance remains significantly below expectations, examine whether the market’s response to the setup has changed in qualitatively different ways.
The most important discipline in the structured review is following the sequence rather than jumping to the most emotionally salient conclusion. Most reviews that conclude “my edge is broken” have not adequately examined process consistency or regime conditions. Most reviews that conclude “everything is fine” have not adequately examined whether the rolling expectancy has genuinely exited its normal range. The sequence is designed to prevent both premature conclusions, and it only works if it is followed in order.
PRACTICAL APPLICATION
Write a one-page review document every time your orange threshold is crossed. It should contain four sections: process assessment with average process score and any systematic deviations; regime assessment comparing current market conditions to the strategy’s optimal environment; statistical assessment placing the current drawdown within the Monte Carlo distribution; and a conclusion that follows explicitly from the first three sections, not from the equity curve alone. Any action taken should be derived from this document.
WHEN THE ANSWER IS THAT THE EDGE IS GONE
After a thorough structured review, the honest conclusion is sometimes that the edge has genuinely degraded. This conclusion should not be reached lightly, and it should not be reached on the basis of a short losing streak or a drawdown within the normal statistical distribution. But when the evidence genuinely supports it, accepting it and acting on it is one of the most important skills a professional trader can develop.
The appropriate response is not to immediately search for a new strategy. That search, conducted under the emotional conditions created by a period of poor performance, almost always produces something optimized for recent market conditions that will fail once those conditions change. The more productive response is to investigate why the edge degraded, what specifically changed in the market or in execution that removed the favorable condition the strategy was exploiting, and whether that change is temporary or structural.
Some edge degradation is temporary. A strategy built around a specific type of liquidity behavior that becomes less predictable during elevated macro uncertainty may recover when that uncertainty resolves. Pausing the strategy when the underlying behavior is absent and returning when it resumes is a more sophisticated response than abandoning it entirely. Permanent degradation does occur, but it is less common than traders in the middle of a difficult period tend to believe.
When permanent degradation is genuinely present, treating it as a research and development problem rather than a failure extracts genuine value from the experience. The hypothesis was valid for a period. Understanding precisely why it stopped being valid is the most useful information available for building the next hypothesis. Traders who approach edge failure analytically extract knowledge from it. Traders who approach it as a catastrophe extract nothing and carry the behavioral damage forward.
PRACTICAL APPLICATION
If a structured review concludes that genuine edge degradation has occurred, write a one-page post-mortem answering three questions: what market behavior was the strategy designed to exploit; what evidence suggests that behavior has changed or disappeared; and what conditions would need to return for the behavior to resume. This forces the analytical framing and creates a written record that can be reviewed in six to twelve months. Many traders who complete this exercise find that strategies they declared dead become tradable again as market regimes cycle.
BUILDING A SYSTEM THAT EVALUATES ITSELF
The traders who navigate edge evaluation most effectively are the ones who have built the evaluation framework into their routine rather than treating it as a crisis response. A framework that only activates during a drawdown activates under the worst possible conditions for objectivity. The same framework applied consistently during all phases of a strategy’s lifecycle, including during strong performance periods, produces substantially better quality of analysis because the emotional conditions are fundamentally different.
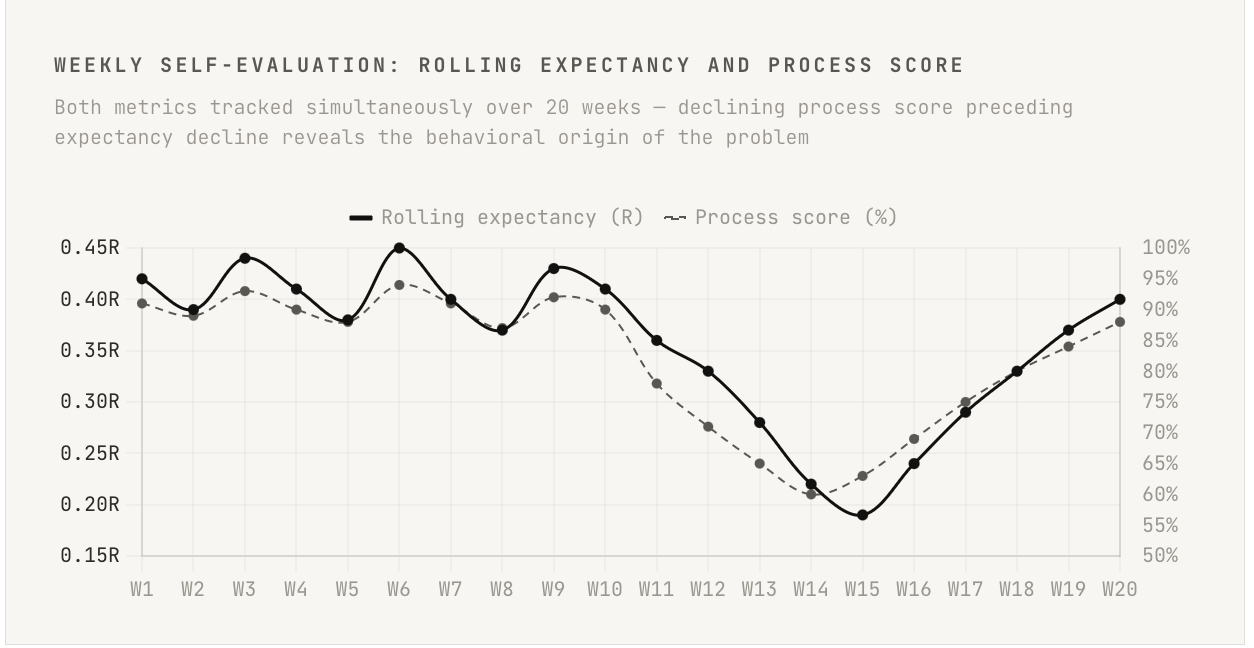
A self-evaluating system tracks, on a rolling basis, the key metrics that distinguish healthy performance from degrading performance: rolling expectancy, process score trend, regime segmentation of results, and the location of current performance within the Monte Carlo distribution. These are not reviewed once per quarter or once per drawdown. They are updated continuously and reviewed weekly as part of a standard process review, regardless of whether performance is good or poor.
Reviewing these metrics consistently during good periods builds genuine familiarity with what the strategy’s performance looks like when it is healthy. That familiarity is the baseline against which deviations become meaningful. A trader who only reviews performance when something appears to be wrong has no reliable reference point for what normal looks like, and cannot distinguish a genuine signal from the noise of a bad week. The discipline of reviewing when it feels unnecessary is what makes the review useful when it becomes necessary.
PRACTICAL APPLICATION
Set a fixed weekly review time where you update and record four numbers: rolling twenty-five trade expectancy in R; rolling twenty-trade process score as a percentage; the regime breakdown of the last twenty trades as a proportion of in-regime versus out-of-regime; and the current drawdown expressed as a percentile within the Monte Carlo distribution. After three months, this log becomes one of the most valuable documents in your trading operation. It will show you exactly when and how your performance and process metrics changed relative to each other, making the distinction between variance and degradation substantially clearer than examining the equity curve in isolation ever could.
CONCLUSION
The question of whether an edge has stopped working is genuinely difficult, and the difficulty is not primarily analytical. The analytical tools are available to anyone willing to use them. Monte Carlo simulation, process scoring, regime segmentation, rolling expectancy tracking — none of these require sophisticated mathematics or expensive software. What they require is the discipline to build the framework before it is needed, the consistency to maintain it during all phases of performance, and the intellectual honesty to follow the evidence wherever it leads.
The two failure modes, abandoning a sound strategy too early and continuing to trade a broken one too long, are both extraordinarily common because both are driven by the same underlying problem: the evaluation is emotional rather than statistical, and it is conducted reactively rather than continuously. A trader who has built a genuine self-evaluation framework will make both mistakes less often, and when they do make them, they will identify the mistake faster and correct it with less damage to the account and to their own confidence.
The deepest practical point is this. The question “has my edge stopped working” has a specific, data-based answer if the right data is being tracked and the right framework is being applied. For most traders, neither condition is in place when the question becomes urgent. Building those conditions into the standard routine, so they are available when they are needed, is the work. It is unglamorous and generates no winning trades by itself. What it does is ensure that the winning trades generated by a sound strategy are not undermined by a premature conclusion that the strategy has stopped working.
The market never tells you whether your edge is broken. It only tells you what happened. The interpretation is yours — and it requires a framework, not a feeling.